Metrics First: 6 Steps to Scale VPS Resources Without Migration
Metrics First: 6 Steps to Scale VPS Resources Without Migration
Diagnose the bottleneck first, then scale the specific resource tied to it. Capture a time-correlated trace of latency, CPU steal/wait, memory pressure, disk I/O, and network throughput before touching anything. If a single-instance CPU or memory ceiling is the constraint, resize vertically. If the problem is availability, concurrency, or fault isolation, scale horizontally.
TL;DR:
- Proper diagnosis requires tracing latency, CPU, memory, disk, and network metrics before scaling to identify the true bottleneck.
- Vertical scaling is ideal for CPU-heavy or memory-bound workloads with short-lived traffic spikes, but has ceiling limits and single-point failure risks.
- Horizontal scaling needs shared storage for session and cache state, with effective health checks and autoscaling policies based on user-centric metrics like latency.
- Response time and queue depth are more reliable scaling signals than CPU percentage, which can be misleading during I/O or thread pool saturation.
- Always measure the impact of resource changes through load testing and trace analysis to confirm the bottleneck has shifted before deploying at scale.
Table of Contents
- What Signals Tell You Which Resource to Scale?
- Vertical Vs Horizontal Scaling: Which Wins for Your VPS?
- How Do You Scale a Single VPS Without Migrating?
- How Do You Scale Across Multiple VPS Instances?
- What Metrics Should Drive Your Scaling Policy?
- How Do You Verify a Scaling Change Actually Worked?
- What Does Scaling VPS Resources Actually Cost You?
- How Does AceRDP Support Scalable VPS Workloads?
- A Developer’s Take on Scaling VPS Resources
- Get Started With a VPS Built for Scaling
- Sources
- FAQ
What Signals Tell You Which Resource to Scale?
The mistake most people make when scaling VPS resources is watching one dashboard, seeing “CPU: 90%,” and reaching for a bigger plan. That’s often wrong. High CPU with flat latency usually means your app is doing exactly what it should. Rising latency with moderate CPU usually means something else entirely: a lock, a slow query, or a saturated connection pool.
Match the symptom to the actual resource before you spend money:
- Swapping or repeated OOM kills → memory pressure, not CPU.
- High run queue and CPU percentage with climbing response times → CPU contention, or a blocking call masquerading as compute load.
- Rising P95/P99 latency with low CPU and low memory → I/O wait, a downstream dependency, or lock contention.
- Dropped connections or timeouts under load → network throughput limits or exhausted file descriptors.
- Disk queue depth climbing while throughput stays flat → storage is the bottleneck, not the CPU or RAM.
The toolkit for this diagnosis is not exotic. top or htop gives you a live read on CPU and memory. vmstat and sar show trends over time, which matters more than a single snapshot. iostat and iotop isolate disk latency and IOPS, docker stats shows per-container resource use if you’re running containers, and perf gets you down to the syscall level when nothing else explains the slowdown. For distributed tracing, something like OpenTelemetry ties a slow request back to the exact function or query causing it.
Here’s the part that trips up a lot of teams: application metrics beat host metrics for autoscaling decisions. Response time and queue depth reflect what your users actually experience. CPU-only triggers frequently miss the real saturation point, because an app can hit its functional limit through blocking I/O or thread pool exhaustion well before the CPU graph looks alarming.
Vertical Vs Horizontal Scaling: Which Wins for Your VPS?
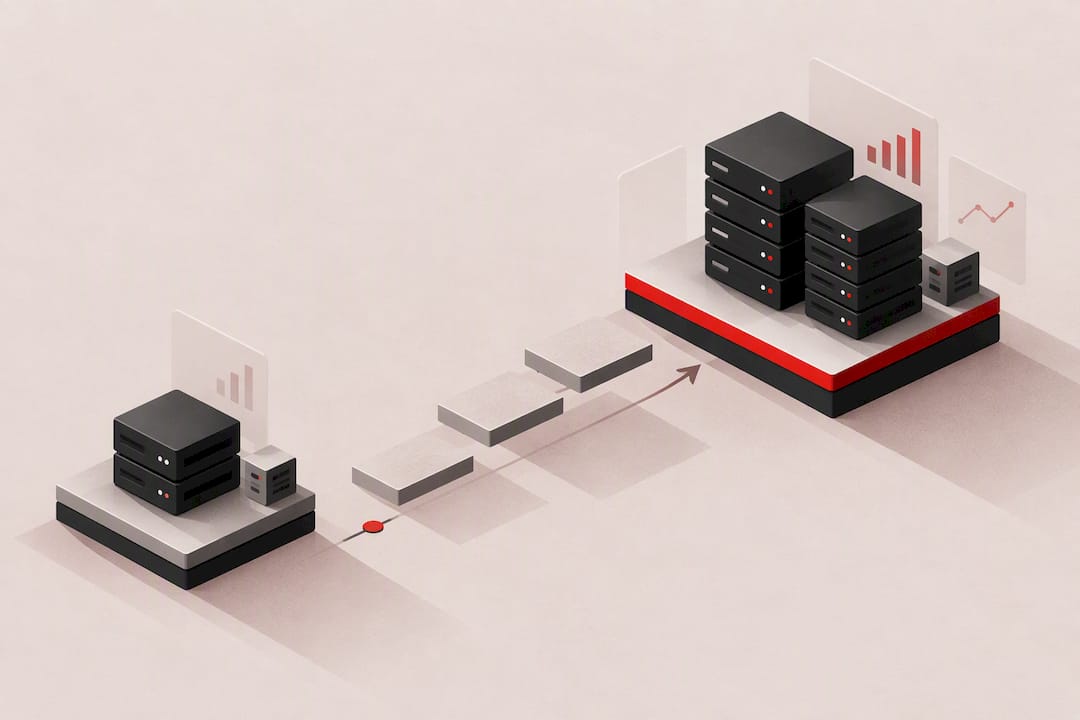
Vertical scaling means upgrading the plan itself, moving to more vCPUs, more RAM, or faster storage on the same instance. Some providers support hot-add for RAM and CPU without a reboot; storage upgrades and certain hypervisor-level changes still typically require one. It’s the fastest fix available, but it has a hard ceiling: eventually you run out of plan tiers, and a single instance is always a single point of failure.
Vertical scaling wins in specific situations:
- CPU-heavy, single-threaded workloads that can’t be split across nodes.
- Memory-bound database instances where the working set just needs more room to breathe.
- Short-lived traffic bursts where spinning up new infrastructure would cost more time than it saves.
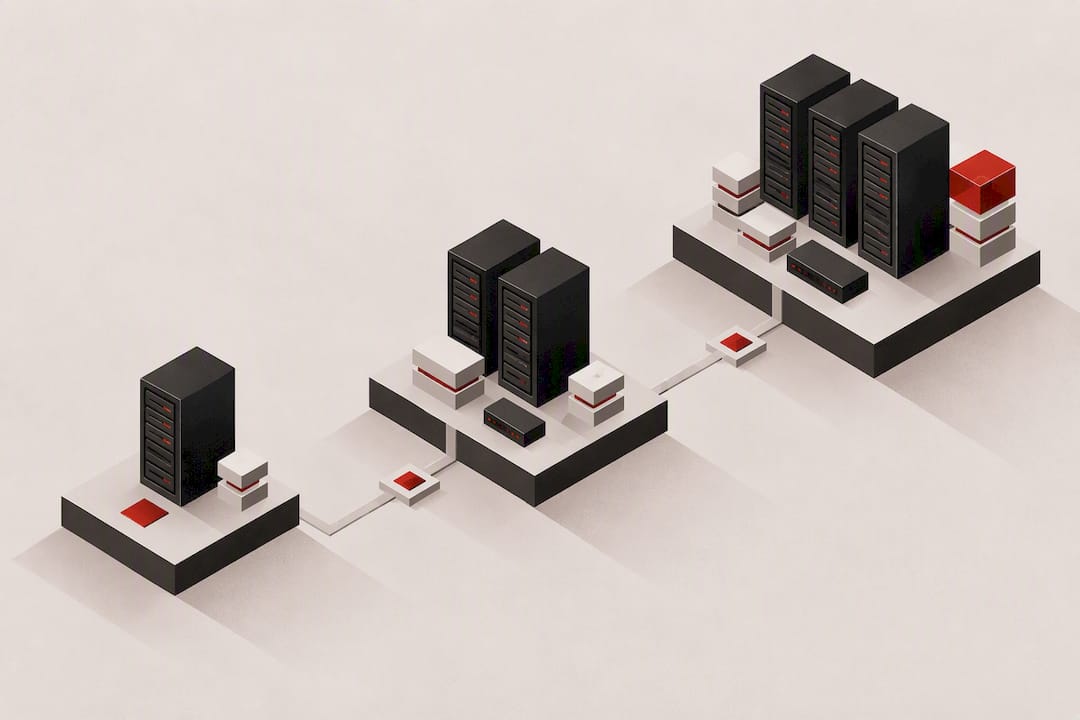
Horizontal scaling, adding more VPS instances behind a load balancer, wins when you need high availability, want to isolate failures, or need to control cost by right-sizing many small instances instead of one large one. It also decouples your capacity from any single hardware ceiling.
The trade-offs are real on both sides. Vertical scaling is operationally simple: one instance to manage, one config to tune, and pricing that’s predictable. Horizontal scaling forces architectural decisions you can’t avoid forever: sessions and state have to move out of the instance and into shared storage or a database, deployments need to account for multiple targets, and cost becomes a function of instance count rather than a flat monthly number.

How Do You Scale a Single VPS Without Migrating?
Before you add a second server, squeeze what you already have. Most VPS instances have more headroom than their default configuration lets them use.
- Confirm the resize actually landed. After a vertical upgrade, check that the guest OS sees the new CPU count and memory (
free -h,nproc). Hot-add usually works for RAM and vCPUs; some storage and certain kernel-level changes still need a reboot. - Set per-service limits with systemd. Cgroup v2 controls like
CPUQuotaandMemoryMaxlet you cap what one service can consume, so a runaway background job can’t starve your production process. AWS documents this pattern for resource limiting under systemd, and it works the same way on any modern Linux distribution. - Use
MemoryHighbefore you use hard limits. The Linux kernel’s cgroup v2 documentation recommends soft throttling for latency-sensitive services, since a hard cap can trigger an OOM kill exactly when you need the service most. - Constrain containers explicitly. Docker sets no limits by default, so a single container can consume the whole VPS. Use
--memory,--memory-swap,--cpus, and--cpu-sharesondocker run, and if you’re on Compose, the deploy resources block does the same job per service. Watchdocker statsfor a few minutes after any change to confirm the container is actually respecting the cap, per Docker’s own resource constraint guidance. - Retune storage after the fact. Moving to NVMe or a higher IOPS tier only pays off if your database’s buffer pool or cache size is adjusted to use the new headroom. A resized instance with an untouched innodb_buffer_pool_size is just paying for capacity it never uses.
- Rebuild caches and adjust worker counts. JVM heap sizes, worker process counts, and connection pool limits were likely set for the old resource envelope. Leaving them alone after a resize is the single most common reason teams don’t see the performance gain they paid for.
Pro Tip: Change one variable per test. If you resize memory and adjust JVM heap in the same deploy, you won’t know which change fixed (or broke) anything.
How Do You Scale Across Multiple VPS Instances?
Horizontal scaling only works cleanly if your application doesn’t depend on any one instance remembering anything. Session data, file uploads, and cache state need to move to a shared store, whether that’s Redis, a managed database, or object storage, before you add a second node. Skip this step and your load balancer will randomly break user sessions the moment it routes a request to a different instance.
A few pieces matter more than people expect once you’re running a fleet:
- Health checks need to be honest. A load balancer that only checks whether port 80 is open will happily route traffic to an instance that’s up but choking on a slow database connection. Check an actual application endpoint, not just the socket.
- Cold instances need a warm-up window. A freshly booted VPS with an empty cache will show worse latency than the rest of the fleet for the first several minutes. Factor that into your health check grace period so the balancer doesn’t yank it back out immediately.
- Autoscaling policies should match your traffic pattern. HashiCorp’s Well-Architected guidance recommends target tracking for most workloads, predictive scaling if your traffic follows a known daily or weekly rhythm, and schedule-based scaling for predictable events like a product launch.
- Set min, desired, and max explicitly. A fleet with no floor can scale down to zero during a quiet period and get caught flat by the next spike; a fleet with no ceiling can run up a bill during a traffic anomaly or an attack.
- Push load off the origin entirely where you can. A CDN in front of static assets and a caching layer in front of your API can flatten a spike before it ever reaches your instances, which is cheaper than adding another VPS to absorb the same traffic.
If you’re running latency-sensitive workloads like trading systems, the calculus shifts again: geographic placement of the VPS relative to the exchange matters as much as raw capacity, a point covered well in this guide to VPS benefits for forex traders.
What Metrics Should Drive Your Scaling Policy?
Picking the wrong trigger metric is how teams end up with a fleet that scales up two minutes after users already noticed the slowdown. AWS’s Well-Architected guidance is direct on this point: 100% CPU is not always the right signal, and workload-specific triggers like request latency, queue depth, or throughput usually track user experience more closely than raw host utilization.
Building a policy that actually holds up under real traffic takes a few concrete steps:
- Establish a baseline first. Run your normal traffic for a few days and record what “healthy” looks like for latency, queue depth, and CPU. Without this, your thresholds are guesses.
- Set scale-up thresholds below the pain point, not at it. If P99 latency starts degrading at 800ms, trigger scaling at 500 to 600ms, since new capacity takes time to come online.
- Use cooldowns to stop flapping. A cooldown period between scaling actions prevents a fleet from adding an instance, seeing the metric normalize, removing it, and repeating that cycle every few minutes.
- Prefer target tracking over static step scaling for variable traffic, and reserve step scaling for workloads with well-understood, discrete load tiers.
- Track scaling frequency as its own quality signal. A policy that fires constantly is telling you the threshold or cooldown is wrong, not that your traffic is unusually volatile.
Amazon’s own Lightsail documentation makes the same point about establishing baselines before configuring alarms: meaningful alerts depend on knowing what normal looks like first. Correlate every scaling event with your trace and log data afterward. If the fleet scaled and latency didn’t actually improve, the trigger metric is wrong, not the scaling mechanism.
How Do You Verify a Scaling Change Actually Worked?
A resize or a new instance doesn’t mean anything until you’ve measured it. Skipping this step is how teams end up doubling their VPS spend for a problem that was actually a slow database query the whole time.
- Load test before and after, using the same script. Tools like JMeter, Locust, or Vegeta let you replay a realistic request pattern and measure P95/P99 latency, error rate, and throughput on both sides of the change.
- Stress test past your expected ceiling, not just up to it. A synthetic test that only reaches your average load tells you nothing about failure behavior. Push until something breaks, then note exactly what broke, whether it’s connection limits, disk queue depth, or memory.
- Watch host-level tools during the test, not just after.
stress-ngfor synthetic host load,docker statsfor container-level use, andperffor anything CPU-bound in ways that don’t show up in application metrics. - Capture time-correlated traces before and after the change. This is the step people skip, and it’s the one that catches a scaling change that just moved the bottleneck instead of fixing it, since a resized instance can shift the constraint straight to a downstream database or API without touching latency at all.
- Confirm the bottleneck actually moved. If CPU usage dropped but latency didn’t, the real constraint was never CPU, and you just bought capacity you didn’t need.
What Does Scaling VPS Resources Actually Cost You?
A vertical upgrade is usually the cheaper move on paper: one bigger invoice instead of several smaller ones, no load balancer to configure, no additional monitoring targets. Horizontal scaling carries hidden costs that don’t show up in the sticker price: additional OS licenses if you’re on Windows, backup jobs multiplied across every instance, and a monitoring stack that now has several targets instead of one.
The failure modes differ too. A single vertically scaled instance is one hardware failure away from a full outage. A horizontal fleet trades that risk for noisy-neighbor problems and cold-start latency every time a new instance joins the pool.
A few guardrails keep either approach from running away on cost:
- Set a hard max-instance limit so a traffic anomaly or an attack can’t scale your fleet into a runaway bill.
- Use scheduled scaling for predictable low-traffic windows instead of relying on reactive downscaling alone.
- Put budget alerts on the account, not just performance alerts on the instances.
- Make downscaling conservative. Losing capacity too aggressively during a temporary lull is worse than paying for a few extra minutes of headroom.
If you’ve hit the ceiling of what a handful of VPS instances can reasonably manage, or your team can’t keep up with the operational overhead, that’s the point to look at managed orchestration or a hybrid setup rather than adding a ninth manually configured node.
How Does AceRDP Support Scalable VPS Workloads?
Some VPS providers build plans around modern infrastructure and NVMe storage specifically because scaling decisions depend on having real headroom to work with, not a plan that’s already maxed out at idle. Instant provisioning means a horizontal scaling test doesn’t cost you an afternoon waiting for a new instance to come online, and DDoS protection plus multi-location deployment give you options for both fault isolation and latency-sensitive placement.
If you’re applying the diagnostics in this guide to your own infrastructure, a practical starting sequence looks like this:
- Pick a plan close to your current baseline rather than over-provisioning blind.
- Run the same diagnostic commands covered earlier (
vmstat,iostat,docker stats) against the new instance before changing anything else. - Turn on monitoring and backups immediately, not after the first incident.
- Treat the first month as a tuning period, and adjust worker counts, cache sizes, and quotas as real traffic data comes in.
A Developer’s Take on Scaling VPS Resources
Measurement comes before action, every time. The instinct to upgrade a plan the moment a graph looks red is understandable, but it skips the one step that actually tells you what’s wrong. Run small, controlled experiments and change one variable at a time; changing CPU allocation and JVM heap size in the same deploy tells you nothing useful when latency improves.
My rule of thumb: test first, then scale. A short vertical bump is fine when it clears the actual bottleneck. If it doesn’t, or if the real need is availability rather than raw capacity, plan the horizontal move properly instead of layering another quick fix on top of the last one.
— AceRDP
Get Started With a VPS Built for Scaling
Some providers give you modern CPU headroom and NVMe I/O to actually run the diagnostics in this guide instead of hitting a ceiling five minutes into a load test. With instant provisioning across multiple plans, you can spin up a test instance at roughly your current baseline, throw the same load test at it, and see the real numbers before committing to a bigger tier.
The practical path: pick a plan close to your current resource footprint, take a snapshot before you touch anything, then run your load test script against the new instance and compare P95 latency and CPU wait side by side with your old numbers.
| Step | Action |
|---|---|
| 1 | Choose a VPS plan close to your current CPU/RAM baseline |
| 2 | Snapshot the current instance before any change |
| 3 | Run the same load test script pre- and post-resize |
| 4 | Compare P95/P99 latency, not just CPU percentage |
| 5 | Retune buffers, worker counts, and heap sizes after the resize |
Once the numbers confirm the bottleneck actually moved, set up your instance on AceRDP and apply the same monitoring and scaling policy you just tested.
Sources
- Control Group v2 — The Linux kernel documentation
- Scale servers | Well-Architected Framework | HashiCorp Developer
- Resource limiting in AL2023 using systemd (AWS docs)
FAQ
What’s the first thing to check before scaling a VPS?
Capture a time-correlated trace of latency, CPU steal/wait, memory pressure, disk I/O, and network throughput before making any change. Tools like vmstat, iostat, and docker stats will show you which resource is actually constrained, so you don’t upgrade CPU when the real problem is disk I/O.
Is vertical or horizontal scaling better for a VPS?
Neither wins universally. Vertical scaling fits CPU-heavy or memory-bound single-instance workloads and short traffic bursts, while horizontal scaling fits stateless services that need high availability and fault isolation across multiple instances.
Why shouldn’t I use CPU percentage as my main scaling trigger?
CPU can look fine while your application is actually saturated through blocking I/O or a full connection pool, so latency and queue depth usually reflect user experience more accurately, according to AWS’s own guidance on dynamic scaling.
How do I stop my autoscaling policy from flapping?
Set a cooldown period between scaling actions so the system doesn’t add and remove capacity every few minutes chasing a metric that’s still settling. Pair that with thresholds set below your actual pain point, since new instances need time to warm up before they help.
Does AceRDP support scaling a workload as it grows?
AceRDP’s plans range from Bronze up to Legend on AMD Ryzen infrastructure with NVMe storage and instant provisioning, so you can move to a higher tier or spin up an additional instance without a lengthy setup process. Current pricing for each tier is listed on the AceRDP plans page.